


Table of contents
- Introduction
- Section 1: Classification Metrics
- Accuracy
- Precision and Recall
- F1 Score
- ROC Curve and AUC
- Section 2: Regression Metrics
- Mean Absolute Error (MAE)
- Mean Squared Error (MSE) and Root Mean Squared Error (RMSE)
- R-squared and Adjusted R-squared
- Section 3: Clustering Metrics
- Silhouette Coefficient
- Section 4: Ranking Metrics
- Mean Reciprocal Rank
- Normalized Discounted Cumulative Gain (NDCG)
- Section 5: Advanced Metrics and Considerations
- Conclusion
Introduction
Machine learning metrics are the cornerstone of model evaluation, playing a critical role in the development and validation phases. These metrics provide quantifiable measures of a model’s performance and are crucial for comparing different models, tuning parameters, and ultimately selecting the best model for deployment.
Section 1: Classification Metrics
Accuracy
Definition: Accuracy is the most intuitive performance measure and it is simply a ratio of correctly predicted observation to the total observations. It is useful when the class distribution is similar.
Formula: Accuracy=Number of Correct PredictionsTotal Number of PredictionsAccuracy\=Total Number of PredictionsNumber of Correct Predictions
Limitations: Accuracy is not suitable for imbalanced class problems. For instance, if a model is designed to detect fraud where 95% of the data is non-fraudulent, a naive model predicting ‘non-fraud’ will still achieve a 95% accuracy.

A confusion matrix can be visualized showing true positives, true negatives, false positives, and false negatives
Precision and Recall
Precision is the ratio of correctly predicted positive observations to the total predicted positives. High precision relates to a low false positive rate.
Recall (Sensitivity) is the ratio of correctly predicted positive observations to the all observations in actual class.
Trade-off: Increasing precision lowers recall and vice versa. This trade-off can be combined into the F1 Score.

Precision and recall can be plotted on a bar chart for a comparative view of multiple classifiers.
F1 Score
Definition: The F1 Score is the 2*((precision*recall)/(precision+recall)). It is an overall measure of a model’s accuracy that combines precision and recall.
Use-case: When you want a balance between Precision and Recall and there is an uneven class distribution (large number of Actual Negatives).
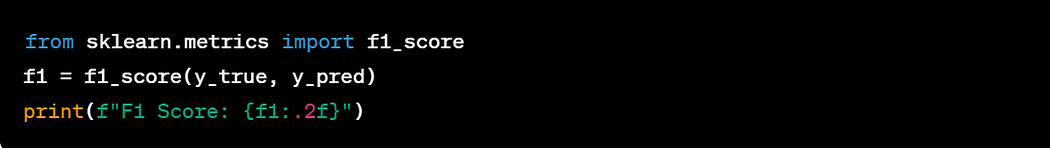
F1 scores for different thresholds or classes can be plotted to show their variation with changing thresholds.
ROC Curve and AUC
ROC Curve (Receiver Operating Characteristic curve) is a graph showing the performance of a classification model at all classification thresholds.
AUC (Area Under the Curve) represents the degree or measure of separability. It tells how much the model is capable of distinguishing between classes.
Illustration: A graph with True Positive Rate on the y-axis and False Positive Rate on the x-axis, with the area under the curve highlighted.

The ROC curve is a plot that illustrates the diagnostic ability of a binary classifier system as its discrimination threshold is varied.
Section 2: Regression Metrics
Mean Absolute Error (MAE)
Definition: MAE measures the average magnitude of the errors in a set of predictions, without considering their direction.
Formula:
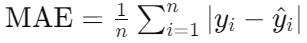
Interpretation: It’s the average over the test sample of the absolute differences between prediction and actual observation where all individual differences have equal weight.

Mean Squared Error (MSE) and Root Mean Squared Error (RMSE)
MSE is the average of the squares of the errors. It’s more popular than MAE because MSE “punishes” larger errors.
RMSE is the square root of the mean of the squared errors. RMSE is even more popular than MSE because RMSE is interpretable in the “y” units.

Plotting actual vs. predicted values with a line of perfect fit can visually represent how MSE and RMSE relate to variance in the data.
R-squared and Adjusted R-squared
R-squared measures how well the observed outcomes are replicated by the model, based on the proportion of total variation of outcomes explained by the model.
Adjusted R-squared also takes into account the number of predictors in the model and adjusts for the number of terms in the model.

Section 3: Clustering Metrics
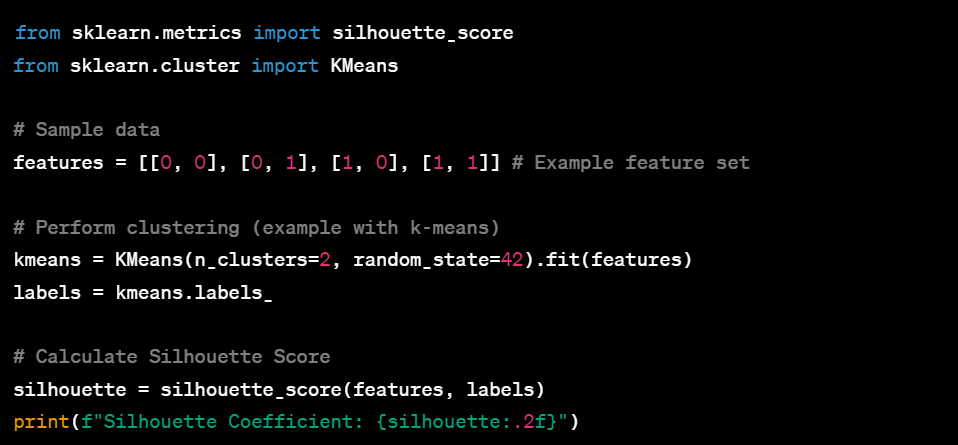
Silhouette Coefficient
Definition: Measures how similar an object is to its own cluster compared to other clusters.
Davies-Bouldin Index

Definition: The average ‘similarity’ between each cluster and the most similar one. Lower values indicate better clustering.
Section 4: Ranking Metrics
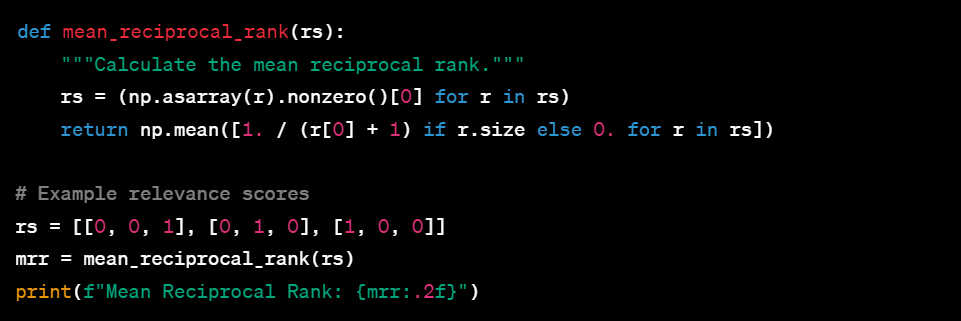
Mean Reciprocal Rank
Definition: The average of the reciprocal ranks of the first relevant answer.
Normalized Discounted Cumulative Gain (NDCG)
Definition: Measures the performance of a ranking system based on the graded relevance of the recommended items.

Section 5: Advanced Metrics and Considerations
Discuss advanced metrics such as Log Loss, which measures the performance of a classification model where the prediction input is a probability value between 0 and 1, and Cohen’s Kappa, which measures the agreement between two raters.
Log Loss:

Cohen’s Kappa:

Conclusion
Choosing the right metric is paramount to developing powerful machine-learning models. This comprehensive overview provides a foundation, but the learning journey in the ever-evolving field of machine learning is continuous.